The leading driver is soaring butterfat levels. In 2024, the average U.S. fat test was 4.24%, up from 3.74% in 2014 and 3.68% in 2004, according to USDA. Not only did butterfat levels reach a new all-time high last year, but the pace of gain has risen, too. Consider this: between 2004 and 2014, the compound annual growth rate was just 0.2%. From 2014 to 2024, the growth rate increased to 1.2%. And, during 2024, the fat level increased by 2.2%!
The same is true, but to a lesser extent, on the protein side. In 2024, milk protein averaged 3.30%, up from 3.12% in 2014 and 3.04% in 2004, according to Federal Milk Marketing Order data. And, during three of the past four years, protein content has increased by more than 1% annually. That was never true during the preceding 20 years.
Putting that all together – milk has 15% more butterfat and 8% more protein than it did in 2004. Pretty impressive!
What accounts for the change?
Clearly, there has been more focus on component levels, both from a breeding and nutrition perspective. Also, with some processors setting volume restrictions, increasing components has been a way to improve milk value while still shipping the same number of pounds.
Plus, genomic testing makes it possible to grow component levels at an accelerated pace. As dairy producers selectively advance the best genetics in their herd, that means the potential for each new generation of heifers is increasing at a faster rate than ever before.
Growing components offers other benefits too. Milk frequently gets hauled a long way, so it makes financial sense to be moving more components and less water. Especially as hauling costs are typically allocated on a per hundredweight basis. 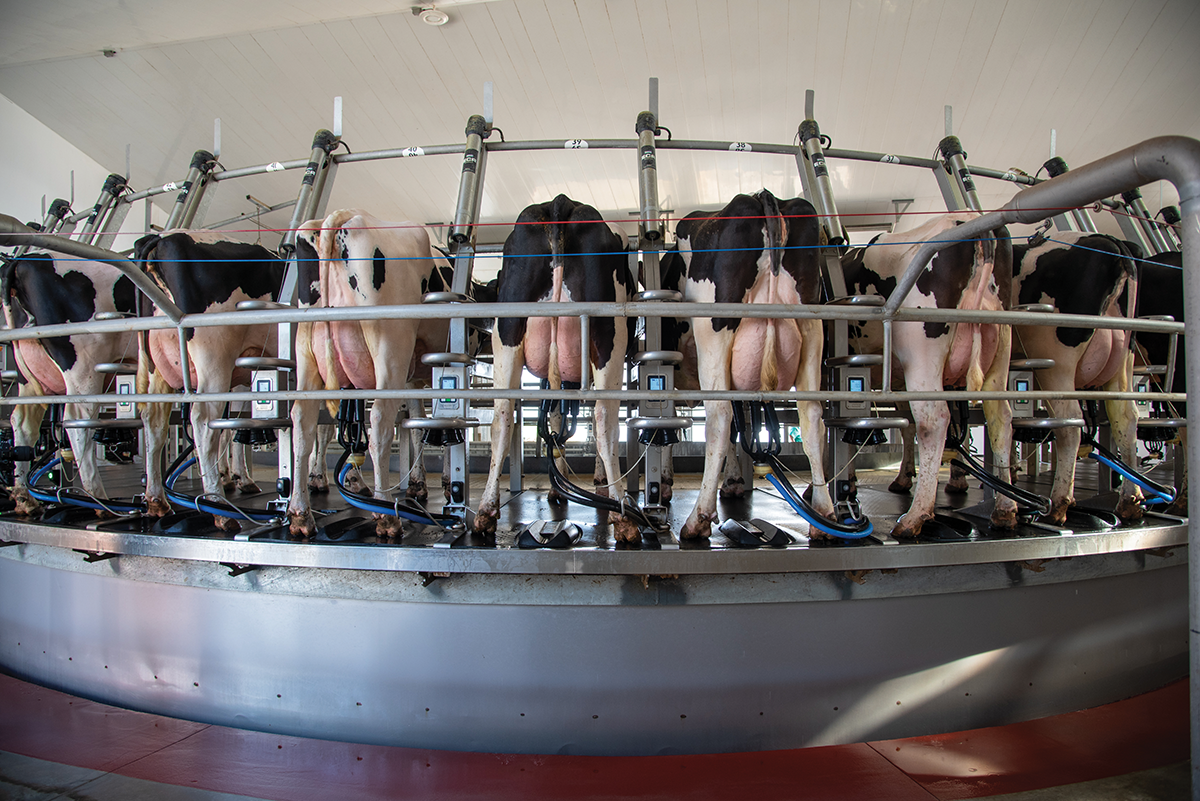
Compared to 20 years ago, on average, each tanker of milk now has 12% more of the valuable fat and protein components and carries 1% less water and other solids. And, from that tanker of milk, that’s enough extra components to boost product yields by 13% if making cheddar cheese or 15% if churning butter.
The increase in component levels corresponds to changing dairy consumer trends. Twenty years ago, nearly one third of U.S. milk was consumed as fluid milk – so there was value in the water. In 2024, that amount was below 20%. Today consumers eat more dairy in the form of higher-density products like cheese, butter or yogurt. Plus, with a handful of new or expanded cheese plants opening over the past two years, there is continued demand for both protein and fat as processors continue to grow cheese production.
But, growing component levels – and particularly as the increase in fat levels is outpacing the growth in protein levels – has created some challenges on the processing side. Today, many cheese plants start the make process by separating out some of the fat – allowing them to achieve the proper balance of fat:protein to make cheese. And, then they typically sell the extra cream.
Another important demand center for increasing milk solids levels is the international market, as exports now account for more than 15% of U.S. output. The two main export products - cheese and nonfat dry milk - are both items with minimal water. Here in 2025, cheese exports are on a record pace through May, with strong sales volumes to Mexico, South Korea and Japan. And, with export volumes generally expected to grow in the years ahead, continued focus on milk solids production just makes sense.
What does this mean for the dairy industry?
This shift means focusing on milk solids production rather than just fluid volume. For instance, in 2024, average daily U.S. milk production decreased by 0.5%, but on a milk solids level, output increased by 1.2%. That’s why even in a period with declining milk flows, there still can be increases in dairy product output.
And for producers, it’s important to make sure your herd is living up to its full potential. Genetic advances have made it easier than ever to grow component values, allowing you to capture more value for each hundredweight of milk produced.
Where do we go from here?
Milk from water buffalo can reach more than 11% butterfat. So, it seems like there is still some room to run. Who knows, perhaps 20 years in the future, we’ll look back and see that now is only the beginning of us starting to explore the genetic potential of dairy cows.
Q&A WITH DAIRY MARKET ADVISING DIRECTOR KATIE BURGESS
Q: What drives the price for milk fat? Does cheese production influence the value of milk fat?
A: From a technical perspective, the price of milk fat is solely determined by the price of butter. Of course, cheese has fat in it, but the federal order formulas are set as such that the price of butterfat is held constant whether it is in butter or cheese. Then the price of protein is forced to adjust. By knowing the price of cheese and butterfat, that’s how you back out the protein value.
Q: Are there any challenges to consider with the growing component levels?
A: Yes! The relative imbalance between growth in fat versus protein. In some cases, we’ve seen producers get penalized if their ratios are too far skewed toward fat. The right balance of protein and fat is necessary to properly make cheese. Plus, it doesn’t do any good to make all that fat if processors aren’t going to pay for it.
Q: With U.S. dairy consumer trends and the export markets in mind, how should farmers react and what steps should they take to make sure they are preparing for the long-term and not a short-term financial gain?
A: From my perspective, the biggest benefit of increasing component levels is that you can generate increased revenue on the same fluid volume of milk, thereby increasing your returns relative to your fixed costs.