
By: Kevin Jorgensen and Rick VerBeek, senior sire analysts, Select Sires Inc.
To address this concern, let’s look at industry-wide herd goals. Throughout the U.S. and around the world, many dairy farmers aim to reduce body size or slow the increasing trend for stature. To achieve this, sires with negative linear evaluations for traits like Stature (ST), Strength (SR) and Thurl Width (TW), will be instrumental. With the most ideal mating, sires with negative linears can greatly influence phenotypic progress in these herds.
There’s a lot to consider when looking at linear evaluations in sire selection. First, it is important to familiarize yourself with linear classification scores. Next, we’ll dive into bell curves and standard deviations to better interpret the linear bar charts and make comparisons to the phenotypic performance - what you will see in the barn and milking parlor. And finally, it’s paramount to consider the influence of base changes and the need to reset perspective.
UNDERSTANDING LINEAR CLASSIFICATION SCORES
Holstein classifiers evaluate 18 individual type traits using a linear scoring system to describe or measure each trait. They use a scale of 1-50 to assign a numeric score to each trait rating them from one extreme to the other. For some traits
like Rump Angle and Leg Side View, a 25 is considered desirable. These scores are the foundation of the information used to calculate the genetic evaluations for type traits, which are expressed as STAs.
- Linear Score of 1 = 50-inch cow
- Linear Score of 25 = 55-inch cow
- Linear Score of 35 = 57-inch cow
- Linear Score of 50 = 60-inch cow
TRANSFORMING LINEAR SCORES TO STA
Those linear scores are then put into a genetic evaluation and displayed as STAs. For linear type traits, STAs are generally expressed on a scale from -3 standard deviations to +3 standard deviations with 0 defined as the average for the base birth
year population. There is a 68 – 95 – 99.7 rule when understanding STAs, meaning 68% of the values fall within 1 standard deviation of the mean, 95% of the values fall within 2 standard deviations of the mean, and about 99.7% of the
values fall within 3 standard deviations of the mean. On the bell curve and in Select Sires’ linear trait bar charts, this means that half of the population will have a negative number and half the population will have a positive number.
Simply put, a negative or left-side linear isn’t conventionally bad, but instead further evaluation and consideration of herd goals and phenotypic performance is important.
THE INFLUENCE OF BASE CHANGES
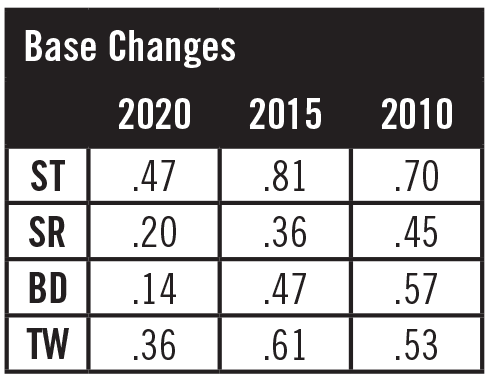 Don’t forget that linear evaluations are subject to base changes. The current STAs are based on the average PTAs of cows born in 2015. Base changes occur every five years and show the genetic change over that time frame. Most recently,
we noted the change from 2010 to 2015. The 2020 base change revealed that cows born in 2015 were much larger than cows born in 2010 and the linear evaluations for ST, SR, Body Depth (BD) and TW reflected this increase. The 2020 base change shows
the trend for increased size is slowing, but it is still increasing.
Don’t forget that linear evaluations are subject to base changes. The current STAs are based on the average PTAs of cows born in 2015. Base changes occur every five years and show the genetic change over that time frame. Most recently,
we noted the change from 2010 to 2015. The 2020 base change revealed that cows born in 2015 were much larger than cows born in 2010 and the linear evaluations for ST, SR, Body Depth (BD) and TW reflected this increase. The 2020 base change shows
the trend for increased size is slowing, but it is still increasing.
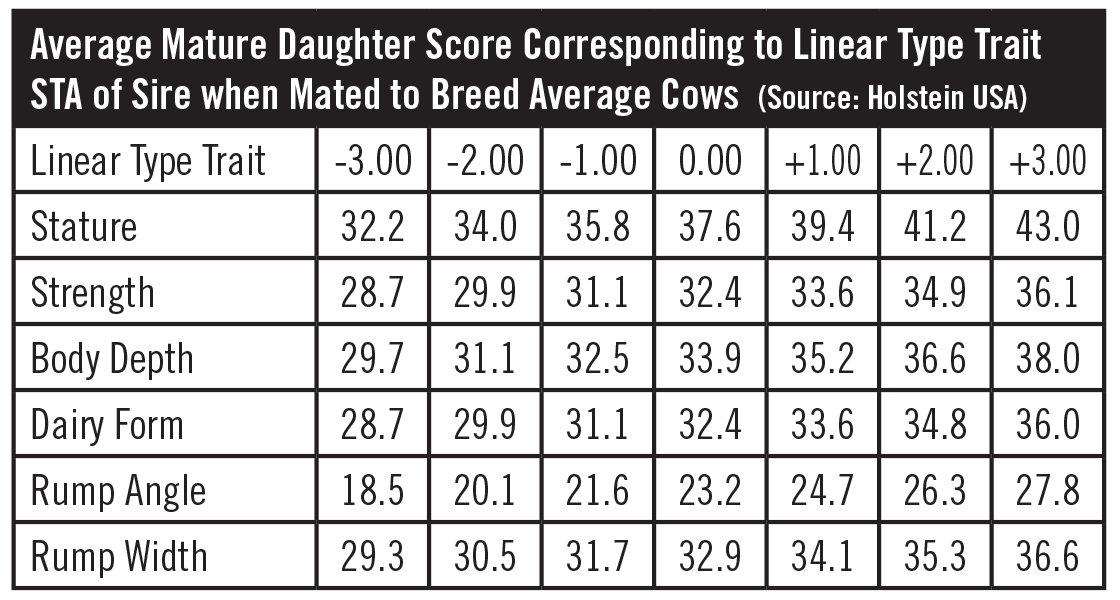
To moderate size in the cow herd, key-in to these linear frame evaluations. For example, when mating a breed average cow to a sire with a -2.00 STA for Stature, farmers can expect the mature daughter to be around 57 inches tall.
We have to reset our expectations of what the STAs represent, especially for frame traits. How we interpret a +1.00 STA today is much different than how it was interpreted 10 and 20 years ago. Research shows that a -2.00 Stature score in 2021 is nearly equivalent to a +1.00 STA from 2000 and similar comparisons can be made for other traits, including Strength and Body Depth. Not only does the genetic base change, but industry trends shift, herd goals evolve, culling preferences are modified and genetic technology advances. For more information about linear evaluations, contact your local Select Sires representative and discover how these “left-sided” linears can make phenotypic strides to meet your herd goals.